3. Submitting an experiment#
The Experiment tab provides a step-by-step interface for building and submitting cycling experiments.
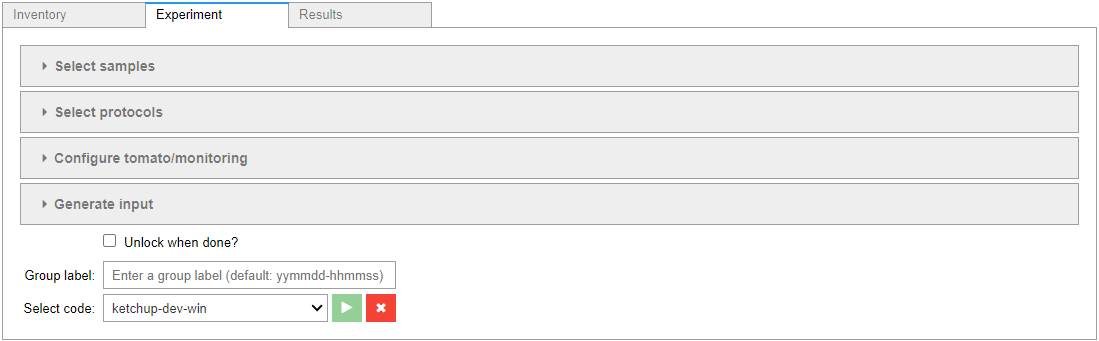
The process involves the following steps:
Selecting samples
Selecting one or a sequence of protocols to run on each sample
Optionally adjusting the settings of each protocol
Generating/previewing the experimental setup
Submitting the experiments
3.1. Samples#
Aurora allows you to submit the same experiment on multiple samples at a time. To start, expand Select samples. Select one or more samples and click the select button (🔽) to move the sample(s) to the Selected panel. To remove sample(s), select the one(s) you want to remove in the Selected panel and click the deselect button (🔼).
Tip
Selecting/deselecting all samples can be done with the select/deselect all buttons (⏬/⏫).
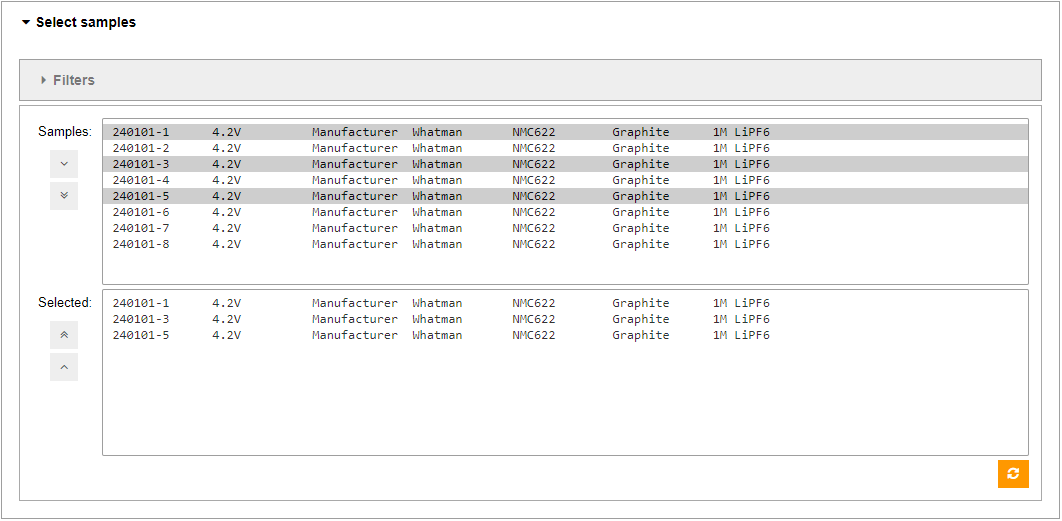
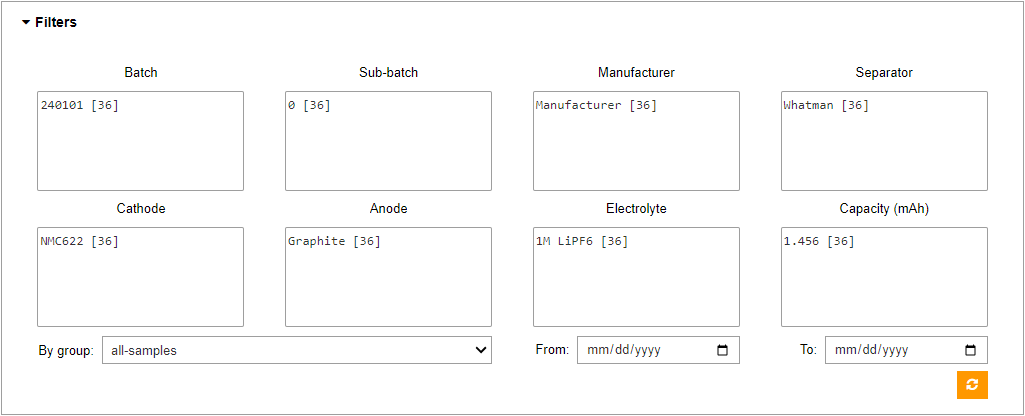
Tip
The Filters dropdown can be used to narrow down the selection options.
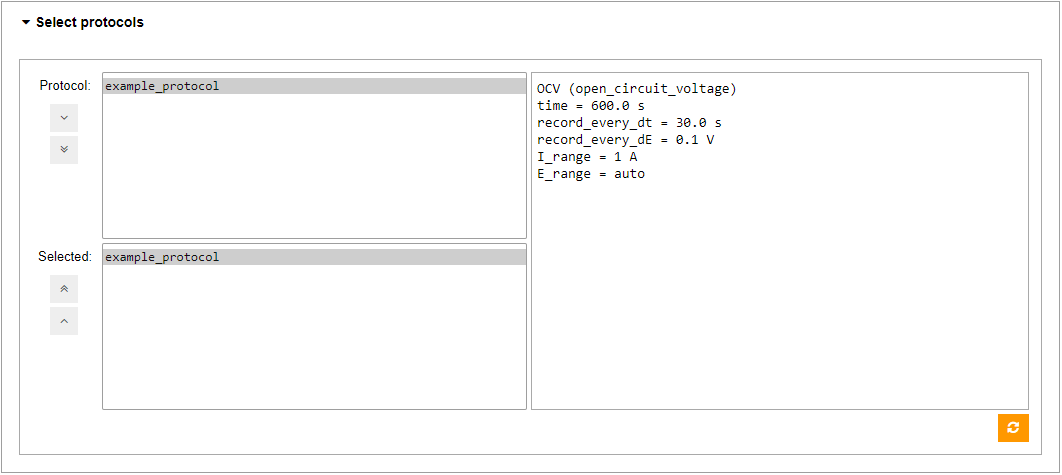
3.2. Protocols#
Next, we need to select the cycling protocols to run on each of the samples. Expand Select protocols and select one or more cycling protocols using the same controls as in the samples section. A preview of the currently selected protocol will show to the right of the selection panel with more detail.
Important
The list of selected protocols represents a sequence to run in the selected order. To enforce this, you can only select one protocol at a time as you construct the sequence.
3.3. Settings#
The last thing to specify is the settings of each of our protocols. To do so, expand Configure tomato/monitoring and select a protocol to set up. Currently, the setup is limited to the level of reporting, and applying live monitoring (see monitoring section below). When ready, click the save button (✅) to save the changes to the protocol.
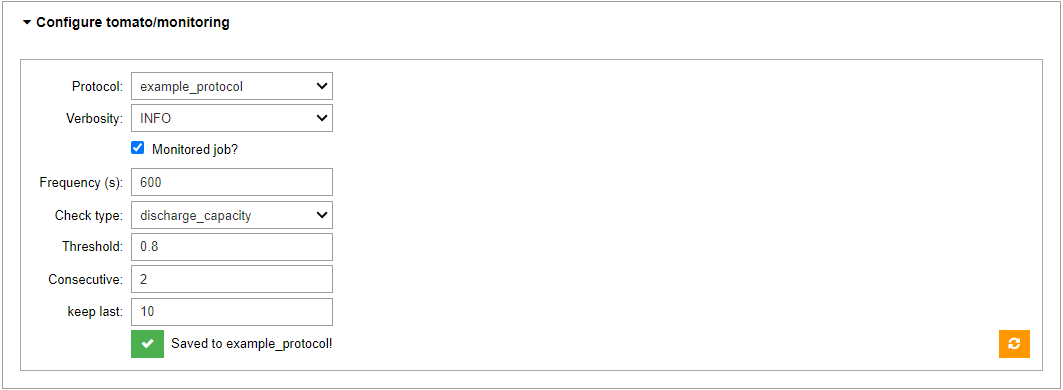
3.3.1. Live Monitoring#
Aurora provides live monitoring for running cycling experiments on demand. If selected, the monitor will poll the running tomato job for data at a given interval (frequency), post-process the data, and compute charge/discharge capacities. The monitor will then use these capacities to assess if the battery sample has passed a given threshold of charge or discharge capacity, depending on the user’s choice.
If the threshold has passed for a given number of consecutive cycles, the monitor will flag the experiment as follows:
🔴 all conditions are presently met
🟡 all conditions have been met at least once in the past
Additionally, the monitor will report the current status of the experiment in the form of the cycle number and current capacity as a percent of the initial capacity - Ex. (cycle #144 : C @ 87.2%).
The monitoring report mentioned thusfar can be seen in the list items of the experiment selector in the Results tab (more information can be found here). However, the monitor will also report its findings in the built-in AiiDA report for the experiment, which can be triggered from terminal via verdi process report <experiment-id>. Here, the above report is amended with the nominal value of the current capacity, and, if one of the above two conditions is applicable, the percent of the capacity that is passed the threshold, and the numbers of all cycles which have met the threshold condition.
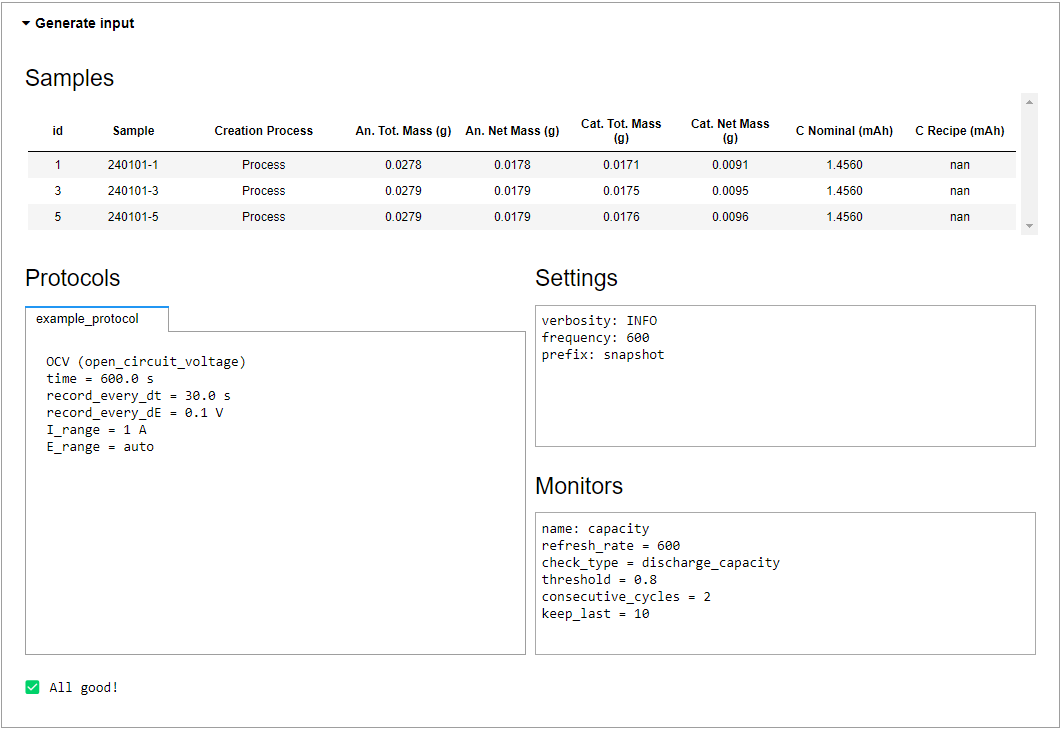
3.4. Input Generation/Preview#
When samples and protocols have all been selected and configured, expand Generate Input to distill your selections into the necessary workflow inputs. This section also serves as a preview of your selections, i.e. the experimental setup.
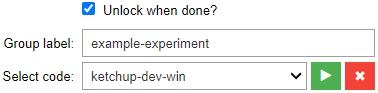
3.5. Submission#
Once input has been generated, you can proceed to submit the experiments by selecting a code (see code setup), checking Unlock when done? if you wish to keep the cycling channel unlocked after the experiment, providing a label for the submission group (see note below), and clicking the submit button (▶️). You can click the reset button (❌) to reset the experiment builder.
Note
On submission, the submitted experiments are grouped into an AiiDA Group node. The group will be labeled with the one provided on submission (datetime stamp by default). This label can be used in the Results section to quickly fetch the experiments for visualization.