4. Visualizing results#
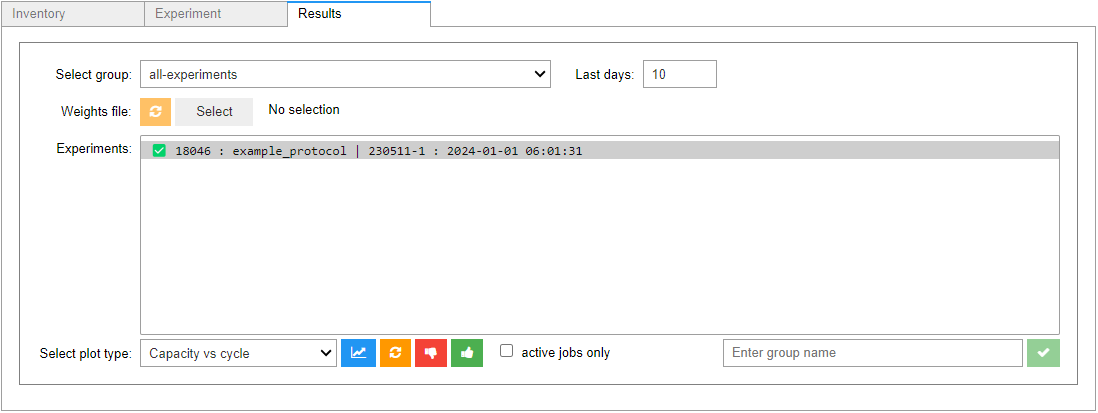
All finished or monitored jobs are ready for inspection in Aurora’s Results tab. Here, you can explore live experiment data including current, voltage, capacity, and more.
Tip
Click the refresh button (🔄️) at the bottom to fetch newly submitted experiments.
Tip
Check the active jobs only checkbox to only view currently running experiments.
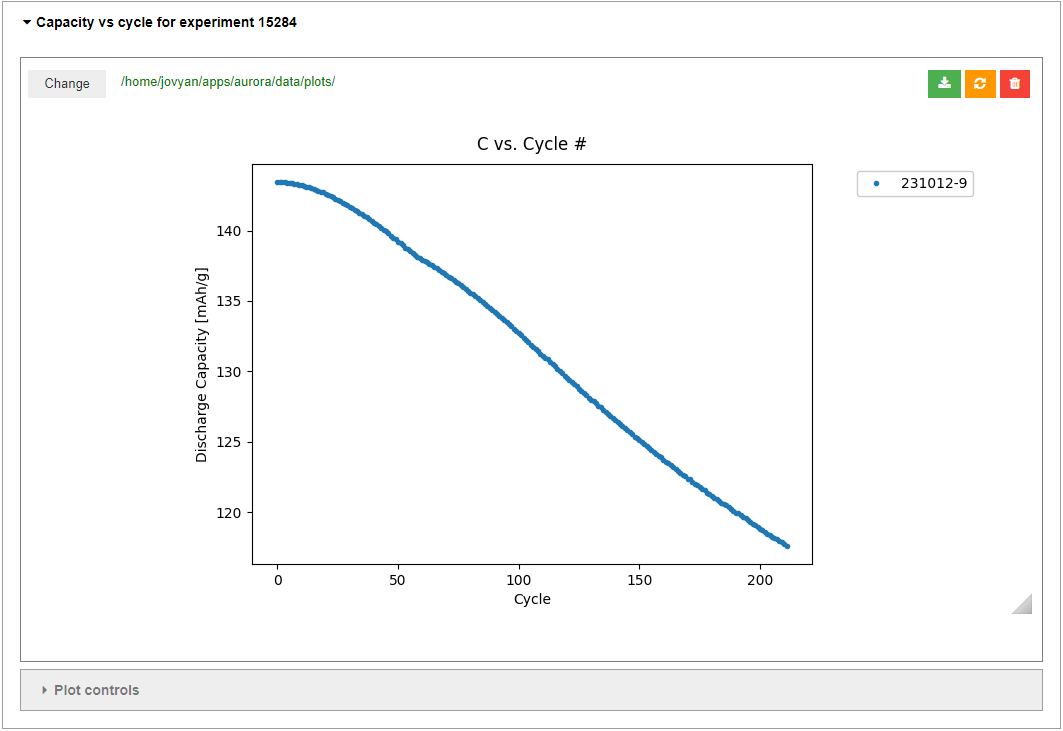
To plot a given property, select the experiment from the selection panel, choose the type of plot you wish to view, and click the plot button (📈). A new plot section will appear below.
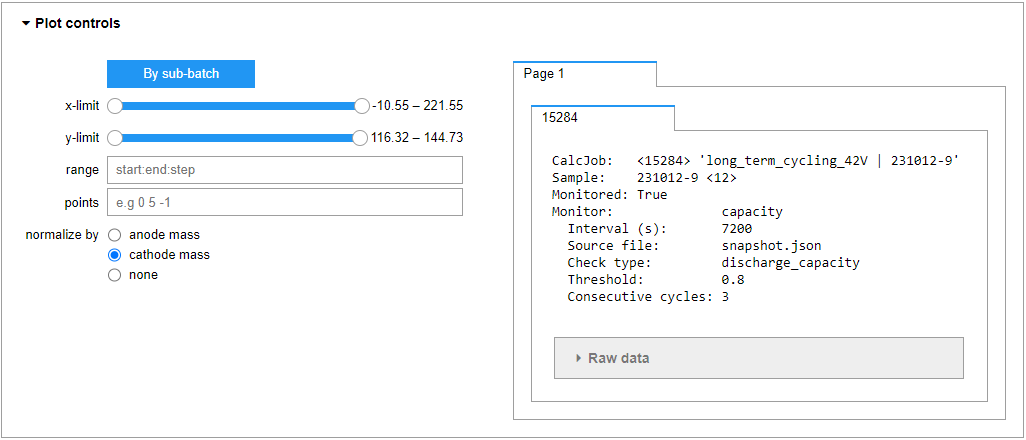
Each plot section comes with various controls in the Plot controls dropdown, such as sub-batching, axes limits, down-selection, and mass normalization. In addition, a summary of experiment metadata is provided to the right of the controls including raw time, current, and voltage data.
Warning
Raw data can become quite large. Keep in mind that depending on the amount of data, expanding the Raw data dropdown may slow down performance significantly. This is more severe for longer cycling experiments.
4.1. Experiment Selection Panel#
Each list item in the experiment selection panel includes the following items:

Job flag
Job id
Job label
Datetime stamp
Job status (if available)
Important
Only finished or monitored jobs will appear in the experiment selection panel.
The following sections provide additional information for each of these components.
4.1.1. Job Flag#
The job flag changes throughout the lifetime of the experiment. The flag is assigned either by the workflow, or by the job monitor if assigned (see live monitoring). The possible flags are:
Assigned by workflow:
🍅 - active job is with tomato
🚨 - job terminated due to unexpected/unhandled error
🚫 - job terminated by tomato
✅ - job finished without errors
Assigned by monitor:
🟡 - job status has met the user-specified condition at least once in the past
🔴 - job status is currently meeting the user-specified condition
☠️ - job terminated by user (see manual job termination)
4.1.2. Job Id#
The job id is a unique identifier in the AiiDA database table of experiments. The id can be used in AiiDA’s command-line utility verdi to check in which AiiDA workflow stage the experiment is currently. More information on the type of queries you can make with verdi, see the official AiiDA documentation for the verdi CLI.
The id can also be used to produced a detailed AiiDA report for the experiment, including information provided by the monitor, if one is assigned to the experiment (see live monitoring).
4.1.3. Job Label#
A job label is assigned to each experiment in the form of <protocol label> | <sample label>, for example example_protocol | 240101-1. The label is mostly there for quick identification.
4.1.4. Datetime Stamp#
A datetime stamp is also provided marking the time of submission in the form of YYYY-MM-DD hh:mm:ss.
Note
The timezone is set to CEST for historical reasons.
4.1.5. Job Status#
If a monitor is assigned to the experiment, at a user-specified interval, the monitor will poll the job for its status and prepare a report (see live monitoring). If at least one charge/discharge cycle has completed, the monitor will report the current cycle number and capacity as a percent of the initial capacity, for example, (cycle #... | C @ ##.#%).
4.2. Manual Job Termination#
You can terminate an experiment from the app at any point by selecting the experiment in the selection panel and clicking the thumbs down button (👎). On click, an ❌ will be appended to the flag signifying that the experiment is marked for termination. The monitor will execute the termination order in its next polling event. To cancel the termination order, click the thumbs up button (👍). On click, the ❌ flag will be removed.

Note
A monitored experiment will inform the user of its status through its assigned monitor via the job flag and status (see previous section). This allows the user to make an informed decision when considering if an experiment is to be terminated prematurely.
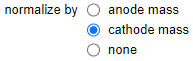
4.3. Mass Normalization#
Analyses involving capacity are sensitive to the electrode mass. As such, Aurora provides mass normalization controls to each of these plots, allowing capacity mass normalization w.r.t either or no electrode.
On selection, Aurora will attempt to fetch the electrode weights from the sample node associated with the experiment and stored in the AiiDA database. The user can override the stored weights by selecting a custom weights file.

Important
Aurora assumes a .csv-format file similar to that used when importing samples.
To reset the selection of a custom weights file and resume fetching from the database, click the reset weights file button (🔄️).
Note
If AiiDA is unable to apply normalization from either source, it will default to no normalization.
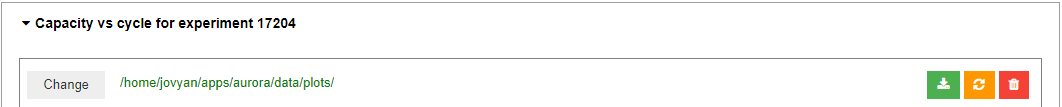
4.4. Plot Data Download#
Aurora’s visualizer is designed to provide simple graphical analyses. However, the user may be interested in improving the plot quality, for example, when preparing a publication, or to plot the data in a format not currently provided in the app.
To this end, Aurora provides functionality to download the current state of any plot, exporting the data in a ready-to-plot .csv format. To do this, first set the plot to the desired state by adjusting its controls, optionally change the default download destination, then click the download button (📥).